How to Build an Emissions Data Management Plan
.avif)
The groundwork that makes climate reporting routine instead of a year-end scramble.
In short: An emissions data management plan is a simple, documented record of every emission source you measure, where each piece of data comes from, how often you collect it, who is responsible for it, and how it gets into your system.
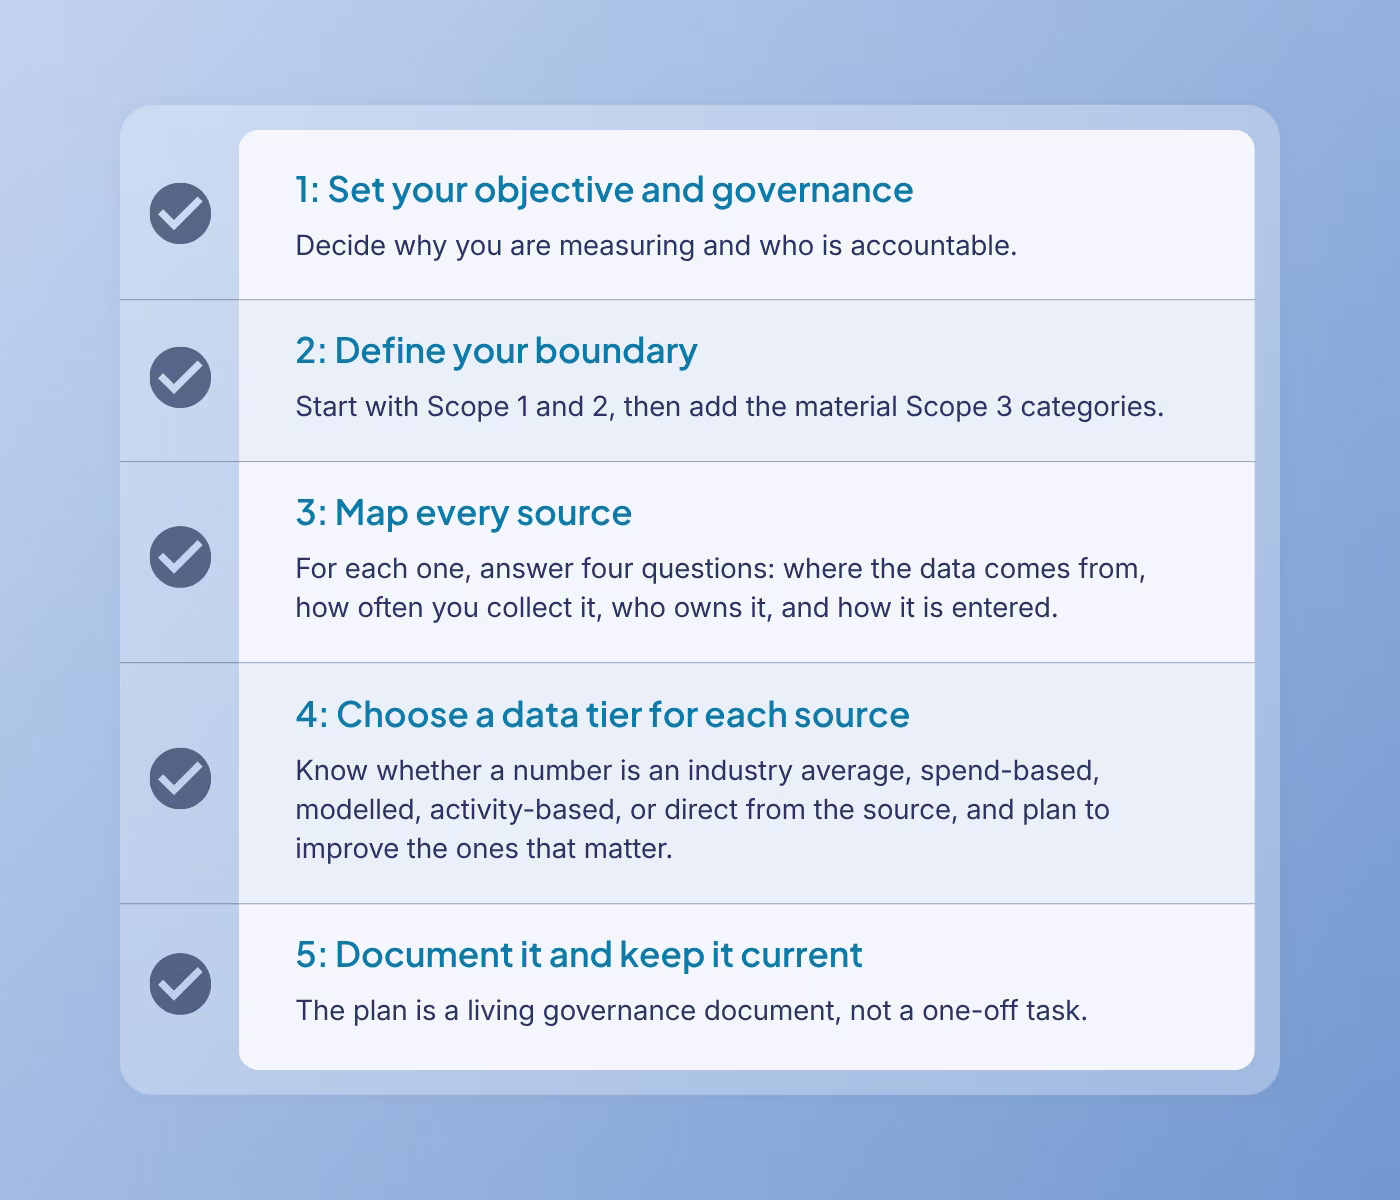
You build one in five steps:
Get this groundwork right and reporting becomes a routine. Skip it and you will be scrambling at the end of every reporting period.
New to this? You can watch our data management planning webinar for the short version before you read on.
Why does emissions reporting start with data, not software?
Most organisations that come to us for help with emissions reporting expect the first question to be about software. It almost never is. The first question is whether the data you are about to report on is any good.
The honest truth is that the unglamorous part comes first. As the saying goes, rubbish data in is rubbish data out. There is no point spending time making emissions calculations based on data that is not reliable, because every number downstream inherits the problem.
People often ask whether they can just automate the whole thing with AI. AI genuinely helps with some tasks, like categorising line items or flagging an unusual figure. What it cannot do is collect clean data from your operations for you, or tell you whether the source data you started with was sound. Especially at the very start, that judgement is human.
So before you choose a platform, you build a plan. The good news is that the plan is straightforward, and once it is in place the rest of the work gets much easier.
What is an emissions data management plan?
An emissions data management plan is a single document that maps your emissions data from end to end.
It lists every emission source in your inventory, tells you which scope each one sits in, records how you calculate it and in what unit, and notes where the data actually lives. Then, for each source, it answers the practical questions that decide whether reporting runs smoothly: where the data comes from, how often you collect it, how it gets entered, and who is responsible.
Think of it less as a compliance form and more as the operating manual for your emissions data. It is the thing you can hand to a fellow team member (even if they’re new) so they know exactly what to collect and from where. It is the thing an auditor wants to see so they can trust your numbers. And it is what turns reporting from an annual panic into a steady rhythm.
The best starting point is to be clear on why you are doing this at all. Be really clear on what your core objectives are, because they differ from one organisation to the next, and then work backwards from there. For most Australian businesses right now the driver is auditable data for mandatory climate reporting. For others it is voluntary sustainability reporting or responding to customer data requests (especially from those now required to report under mandatory climate reporting). When you start uncovering efficiencies, and more usefully the inefficiencies, that is where the real value shows up. Whatever your reason, decide on it first, because it shapes every choice that follows.
Why is data governance the foundation, and what does "good" look like?
Before you write a single row of the plan, you need to lay the foundations. That foundation is data governance.
Our recommendation is to treat data governance to the standard of mandatory reporting (AASB 2) from the start, whatever your actual obligation.
The level of rigour you apply will be guided by your own objectives, whether that is internal reporting, stakeholder commitments, or future-proofing for compliance. If you build to the higher standard early, everything downstream gets significantly easier. That way, when the time comes to formalise the plan, the hard work is already done.
So what does that standard look like?
Under the Australian Sustainability Reporting Standards, organisations have to disclose how they govern climate-related risks and opportunities. AASB S2 asks an entity to identify the board or committee responsible for oversight, to show how often they receive climate information, and to explain how that information feeds into decisions. In practice that means board oversight, clear mandates, and a record of it. If you cannot point to minutes, committee charters, or formal sign-off processes that demonstrate active oversight, that is a governance gap.
Your data management plan is a governance document. It is one of the key things a board or auditor will look for as evidence that climate data is being managed with care. You may not need to operate at full formality today, but the organisations that build good governance habits early are the ones that find reporting seamless rather than stressful.
There is also a resourcing reality here that the research confirms. Purpose Bureau's People and Systems report found that around 74 percent of Group 1 organisations had a dedicated sustainability professional, and that having even one made an organisation roughly 50 percent more likely to be well prepared. The same report found that investment in ESG technology (like carbon accounting software) correlated with preparedness more than 56 percent of the time. Capability and systems are not side issues. They are what separates the prepared from the scrambling.
How do you set your emissions boundary?
Once governance is in place, the next step is to define your emissions boundary. In plain terms, your boundary is what is in and what is out of your emissions inventory.
For most organisations the starting point is Scope 1 and Scope 2. These are your non-negotiables. They are the most straightforward to collect data for, and they sit within your direct control. Lock those in first.
Then comes the real decision: what do you add on top?
Common additions are waste, business travel, employee commute, and working from home. What you choose to include depends on what your business does, where your significant emissions sit, and what your stakeholders expect to see.
Your boundary does not need to be perfect from day one, but it does need to be deliberate and documented.
Record what is in, what is out, and the reason behind each call. And once you set a boundary, keep it consistent. If you change it from one year to the next, your figures stop being comparable, and that undermines the credibility of the whole report. The general principle is simple: start with Scope 1 and 2, add the Scope 3 categories that are material or expected for your industry, and document everything.
One thing to keep an eye on: the GHG Protocol.
The GHG Protocol sets the rules for boundary setting across most frameworks, at the time of writing (June 2026) is being revised. Under the current standard you must disclose and justify any Scope 3 exclusions, but there is no defined minimum. A proposed revision would require organisations to report at least 95 percent of their total Scope 3 emissions, leaving only 5 percent excludable. This is not finalised and is not yet law, but if you are setting your boundary now it is worth keeping in mind so you can future-proof it from the outset.
What is the emissions data quality hierarchy, and why isn't spend-based data enough?
Not all emissions data is created equal, and understanding that changes how you approach every source.
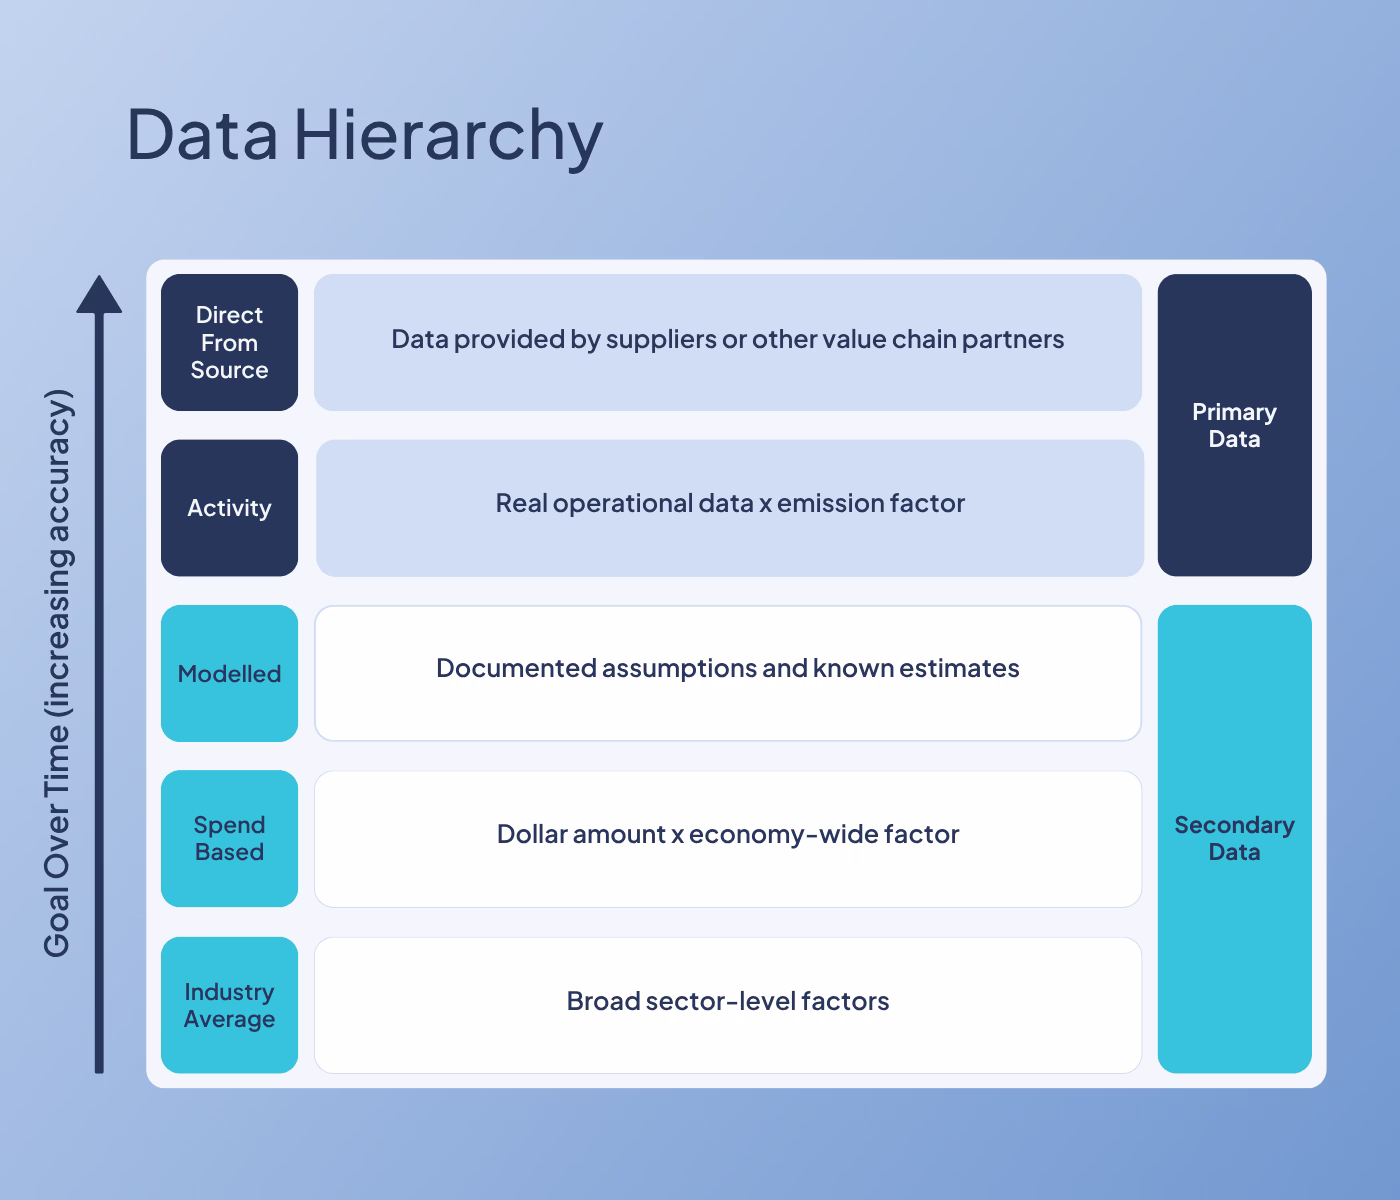
There are five tiers, divided between secondary data and primary data:
- Industry averages (secondary).
Broad sector-level factors, used when you have no specific data at all. Better than nothing, but the least accurate tier and the most likely to attract questions under assurance.
- Spend-based (secondary).
The most common fallback. You take a dollar amount and apply an economy-wide emission factor. It is a blunt instrument that may not reflect what was actually bought or how it was made and transported. Spend-based methods can either overstate or understate emissions because they rely on industry-average economic factors rather than the actual characteristics of the goods or services purchased.
- Modelled or estimated (secondary).
Documented assumptions and known estimates. For example, estimating waste volumes based on bin size and average fill rates, or estimating freight distances using supplier locations. That is acceptable, especially early on, as long as the assumption is clearly documented: what you assumed, why, and the source.
- Activity-based data (primary).
Real operational data, like distance travelled or litres of fuel, multiplied by an emission factor. This is typically considered the preferred approach under the GHG Protocol because it is more representative of real activities. More effort than spend-based, but far more reliable.
- Supplier-specific or direct-from-source (primary).
Actual figures provided by your suppliers or value chain partners, based on their own measured activity data, product carbon footprints, Environmental Product Declarations (EPDs), or verified emissions inventories. This is the gold standard, and the most defensible number you can put in a disclosure.
While spend-based data is a fine starting point, it should not be your permanent answer for material sources as it can often make your inventory look unusually high or low. As you replace industry averages with better activity and supplier-specific data, your footprint often changes significantly and becomes a far more accurate representation of reality.
What auditors like to see is not perfection. It is a plan for moving up the hierarchy and an honest picture of where the gaps are.
What should an emissions data management plan actually include?
Now let’s get into the practical implementation. For most organisations this looks like a well-structured spreadsheet.
A good plan has a stable left-hand side and a working right-hand side.
On the left you list your emission sources, grouped by category. Energy, for example, breaks down into electricity, solar, green power, natural gas, and stationary fuel. You will have similar groupings for travel, goods and services, waste and reuse, employees, refrigerants, water, and anything else relevant to you. Alongside each source you note the scope it falls under, the metric unit you calculate it in, where to find the data, and any useful tips. These columns stay fairly static.
On the right you answer four questions for every single source:
- Where is the data coming from? An invoice, an online portal, a supplier export, a system.
- How often do you collect it? Monthly, quarterly, annually.
- How is it entered? A form, a bulk upload, a direct feed.
- Who is responsible? A named person, not a vague team.
Take electricity as an example. It sits under Scope 2, you calculate it in kilowatt hours, and you find the data on a utility invoice or an online portal, so your plan might record the source as the invoice, the frequency as quarterly, the entry method as a form, and the owner as a named staff member.
💡 One detail that catches people out: this can vary by site. An organisation with multiple locations and different meters needs to answer these questions for each site, because the answers may differ.
Ready to start? Download our free Emissions Data Management Plan template and use it as the backbone of your plan.
What does this look like in practice? The Morris Group story
Morris Group is an independent, family-run Australian business with operations across tourism, hospitality, aviation, and technology, spanning more than 30 sites around the country. Their COO, Sarah, has been leading their emissions work as they prepare for reporting, with the expectation that they will fall into Group 2.
The hardest part was not the measurement, but ownership and resourcing. She admits that, "we really didn't have one person who was ultimately responsible for sustainability in the business. So we needed to be really clear on what roles everyone had to play."
This is where the plan earned its place. According to Sarah, the data management plan "clearly mapped out all the types of data we needed, where that data was likely to sit and how we should go about collecting it." It also clarified "what data was required for emissions reporting and what format it needed to be in." It gave a sprawling, multi-site organisation a single shared reference for who does what.
Her advice for anyone starting out was refreshingly simple: start small, take baby steps, and you will figure things out as you go. You do not have to solve everything at once.
Learn more about how Climate Zero supported Morris Group with its mandatory reporting journey.
Where does software fit in?
A fair number of organisations still manage emissions data in spreadsheets, and a solid data management plan will improve that process on its own. But once your data is structured properly, software changes what is possible.
The shift is twofold. The first is visibility. Instead of discovering an anomaly eight months after it happened while you pull a report together, you can see emissions per source on live tables and graphs and catch issues as they occur. The second is frequency. When you collect small sets of data more regularly (which software enables) the end of the reporting period stops being a scramble, because the data is already there, structured, and ready for auditing alongside your financial reporting.
Once you understand where your data comes from, who is responsible, and how often you collect it, getting it into software is the easy part, usually a bulk upload or an integration with an existing tool. The plan does the hard work. The platform makes the plan easier to run.
From there you can do more than report on your historical emissions. You can build a decarbonisation plan, model different emission pathways, and quantify the return on investment of specific initiatives. Morris Group has started using a modelling tool to test the impact of future actions like solar installs at particular locations, which now gives them a clearer picture of the benefits before they commit.
Whether you choose Climate Zero’s carbon accounting software or another platform, the principle holds. Emissions reporting should not be a one-off task. It is an ongoing one, and it is getting more rigorous, so a system that keeps your structured data current will save you a great deal of time over the long run.
How do you get started without being overwhelmed?
If this still feels like a lot, here is the reassuring part: you do not do it all at once.
Lay the foundation first. Decide your objective, then set your data governance: who is responsible for what, and by when. Get your board and senior leadership involved, and bring in the other teams early, because this is not the sustainability team's job alone. Operations, risk, and finance all have a part to play.
Then take baby steps. Define your boundary, start with the sources you can already get good data for, and prioritise the material parts of Scope 3, which for most organisations means travel, freight, and waste. Map each source with the four questions, record its data tier, and improve the ones that matter over time. Do not be afraid to ask your suppliers for what you need. You would be surprised how much information they can export when you ask.
Once that groundwork is done, the rest of the journey is far simpler. The plan you have built will make it obvious which sources to work on next, and reporting will start to feel like a routine rather than an event.
Build your plan on a proven structure. Download the Emissions Data Management Plan template to map your sources, owners, and data tiers in one place.
FAQ
What is an emissions data management plan? It is a documented record of every emission source you measure, including which scope it sits in, how you calculate it, where the data comes from, how often you collect it, how it is entered, and who is responsible. It is the operating manual for your emissions data and a governance document boards and auditors look for.
Is spend-based data good enough for reporting? It is a legitimate starting point, not a destination. Spend-based data tends to overstate emissions for material sources and is the weakest tier likely to satisfy assurance. The goal is to identify your highest-emitting sources and move them up the data hierarchy toward activity and direct-from-source data, documenting your method as you go.
Do I have to report Scope 3 emissions? Yes, but not immediately. Organisations reporting under AASB S2 can rely on transitional relief in their first reporting year and disclose only Scope 1 and Scope 2 emissions. From the second year onwards, material Scope 3 emissions must also be disclosed. Because Scope 3 data can take time to collect, most organisations are already beginning to identify and measure their key value chain emission sources. A proposed GHG Protocol revision would require at least 95 percent Scope 3 coverage in future, but that is not yet finalised.
Can AI or software do this for me? Software is a major help once your data is structured, and AI can assist with tasks like categorisation and flagging anomalies. Neither can collect clean source data for you or judge whether your starting data was sound. That groundwork is human work, especially at the start.
Where do I begin if I have no plan yet? Start by deciding your objective, then set governance and ownership. Define your boundary beginning with Scope 1 and 2, map your sources with the four questions, and start with the data you can already access. Take small steps and build from there.
Want to see how Climate Zero helps you put your plan to work once the groundwork is done? Book a demo and we will walk you through it.

Download our guide
Explore resources


Subscribe for updates
We’ll send you helpful articles and resources to keep you up to date.
Ready to make carbon accounting and compliance easier?